Application Description
CoinAnk: Your Advanced Cryptocurrency Analysis Platform
CoinAnk is a sophisticated cryptocurrency analytics platform designed for traders and investors seeking in-depth market insights. Leveraging order flow and derivatives data, CoinAnk empowers informed decision-making in the dynamic crypto market.
Real-Time Data Access:
The CoinAnk app provides real-time access to crucial information, including:
- Contract position statistics from leading global exchanges for major cryptocurrencies (BTC, ETH, BNB, ADA, XRP, DOGE, LTC, BCH, LINK, UNI, MATIC, FTM, EOS, and various altcoins).
- Real-time liquidation statistics per exchange, visualized through charts and leaderboards for clear tracking of long and short liquidations.
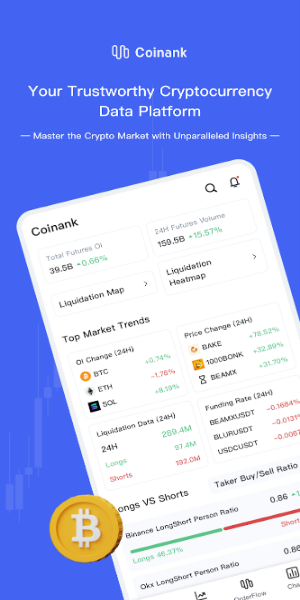
- Aggregated real-time data: active trading volume, long-short ratio, long-short position ratio, and the long-to-short ratio of substantial accounts and positions.
- Comparative analysis of real-time and predicted funding rates across exchanges (USDT and USD), with access to historical funding rate data.
- Grey-scale data analysis capabilities.
Free Mobile App Features:
CoinAnk's free mobile application offers a range of convenient features:
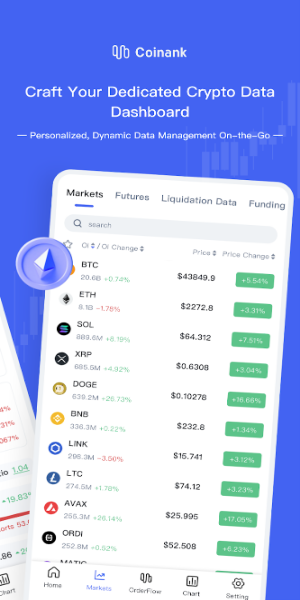
- Real-time cryptocurrency market data viewing and customizable watchlists.
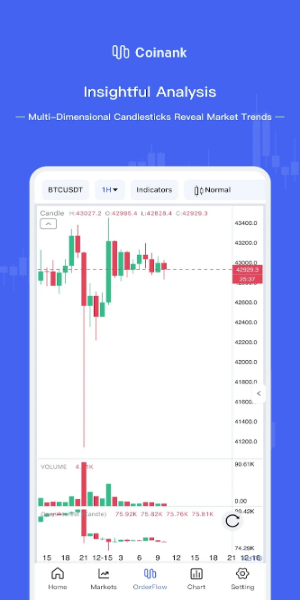
- Real-time K-line charts, enabling cross-exchange contract data comparison and technical indicator generation across various timeframes.
- Customizable alerts for price movements, significant volatility, funding rates, large liquidations, long-short ratios, and on-chain wallet address transfers.
- A robust portfolio tracker for personalized portfolio management.
- Access to numerous technical indicators for data analysis, including AHR999, top escape indicators, Pi cycle top indicators, Poor's multiple indicators, two-year MA multiplier, BTC market value ratio, BTC rainbow chart, and hundreds of other chart and on-chain data statistics.
Key Highlights:
- Floating widget functionality.
- Multi-chart K-line viewing mode for simultaneous real-time display of various cryptocurrency K-line charts.
- Comprehensive visualizations: order flow, footprint charts, liquidation charts, and liquidation heatmaps.

App Functionality:
- Order Flow Visualizations: Detailed visual representations of order flow across major exchanges, providing insights into market sentiment and buy/sell order dynamics.
- Derivatives Data Dashboard: Comprehensive dashboards displaying derivatives data (futures, options, etc.) from leading exchanges, allowing users to monitor market trends and volatility.
- Advanced K-Line Charts: Advanced K-line charts with professional technical analysis tools and indicators for clear price movement visualization.
- Specialized Derivatives Indicators: Specialized indicators for analyzing derivatives data, identifying opportunities and risks (e.g., overbought/oversold conditions, spot vs. derivative price divergence).
- Professional Order Flow Visuals: Detailed visualizations of buying and selling pressure for precise market analysis.
- Customizable Interface: A highly customizable interface allowing users to personalize their trading experience to suit their individual needs and preferences.
Screenshot