Streamline your quantifiable data tracking with Easy Graph! This user-friendly application simplifies monitoring everything from electricity consumption to any other key metric. Effortlessly input daily data and instantly visualize it with clear value graphs and growth charts. Need deeper analysis? Export your datasets as text files for further processing on your computer. Easy Graph is the perfect solution for efficient data management and reporting.
Easy Graph Key Features:
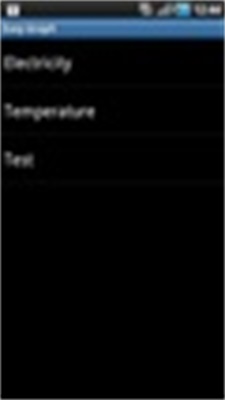
❤️ Simplified Data Management: Easily track and manage your quantifiable data sets. Perfect for recording metrics like energy usage.
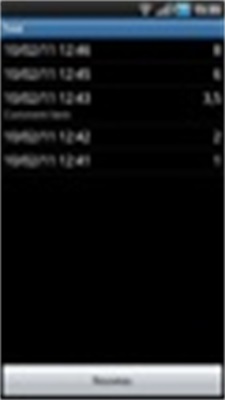
❤️ Intuitive Data Input: Manage multiple date/value lists with ease. The user-friendly interface allows for quick and convenient daily data entry.
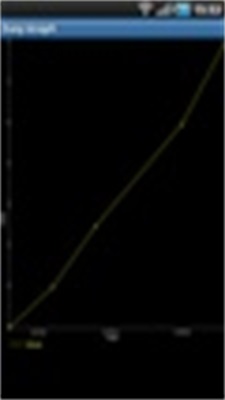
❤️ Clear Visualizations: Understand your data at a glance with value graphs and growth line charts. Easily identify trends and monitor progress.
❤️ Data Export: Export your datasets as text files for detailed analysis on your computer. Ideal for comprehensive reporting.
❤️ User-Friendly Interface: Efficiently monitor and report quantifiable data with an intuitive graphical display.
❤️ Permissions: The app requires internet access (primarily for ads) and external storage access (for data export). These permissions are essential for optimal functionality.
Summary:
Easy Graph provides a seamless experience for anyone needing to monitor and visualize their metrics. Whether for personal or professional use, this app simplifies data management and interpretation. Its intuitive design, simple data entry, and clear visual representations make tracking progress effortless. Download Easy Graph today for hassle-free data management.